Grocery Prices Chart: CostInflation Launches Daily Tracker
Oct 26, 2026
A fixed weekly basket of 34 ingredients shows grocery costs for a family of four across 12 U.S. cities.
New York, NY (PRUnderground) October 26th, 2026
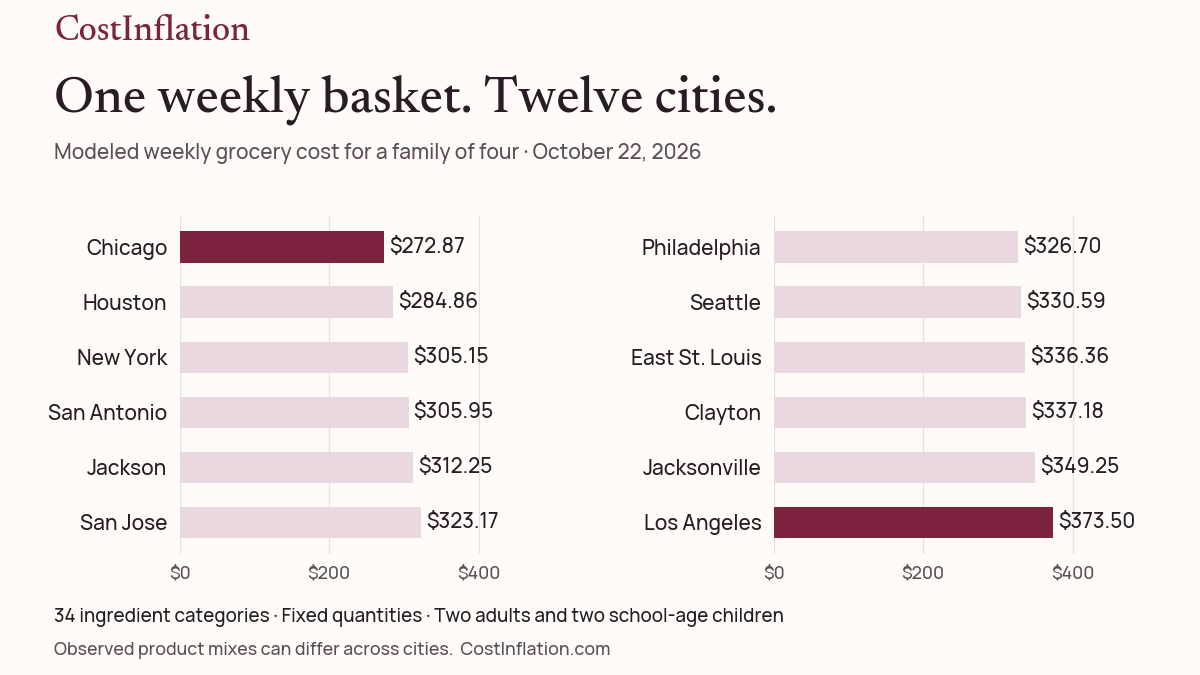
CostInflation today announced the launch of its grocery prices chart, a daily tracker showing what a fixed weekly basket for a family of four costs across 12 U.S. cities.
The Weekly Grocery Cost Index for a Family of Four combines 34 ingredient categories for two adults and two school-age children. Quantities remain fixed across dates and locations, so readers can follow the cost of the same modeled basket over time.
On October 22, the modeled weekly basket ranged from $272.87 in Chicago to $373.50 in Los Angeles across the 12 tracked cities--a $100.63 difference for the same ingredient quantities.
The basket includes everyday groceries such as milk, eggs, chicken, fish, bread, rice, fruit and vegetables. Each ingredient has its own price history, and the basket page shows the quantities used and how much each ingredient contributes to the weekly total.
"Grocery prices are easier to understand when the basket is visible," said the CostInflation Press Team. "Readers can see the quantities behind the total, compare the same basket across locations and explore which ingredients are driving changes in its cost."
The tracker covers New York, Philadelphia, Jacksonville, Jackson, Chicago, East St. Louis, Clayton, Houston, San Antonio, Los Angeles, San Jose and Seattle. Interactive charts show price histories, with observation dates and comparison periods displayed alongside changes.
CostInflation's grocery price calculator lets readers customize the family-of-four basket, change items and quantities, and compare the resulting total across the covered locations. The family basket provides a starting point; each quantity can be adjusted to reflect a different shopping list.
CostInflation is also available in ChatGPT, where readers can explore price histories, compare defined baskets across supported U.S. cities, and inspect dated figures, charts and citations.
The index uses observed retail prices and fixed ingredient quantities to calculate a modeled weekly total. Changes in the mix of observed products can also affect the measured cost. The basket contents and calculation methodology are published alongside the charts.
About CostInflation
CostInflation publishes everyday price histories, basket indexes and interactive tools that help readers understand what things cost and how prices change. Its grocery index connects a weekly basket total with the ingredient prices behind it.
Media contact
CostInflation Press Team
[email protected]
costinflation.com
Press Contact
Name: CostInflation Press Team Email: Contact UsOriginal Press Release.








YOUR NEWS, OUR NETWORK.
Do you have Great News you want to tell the world?
Be it updates about your business or your community, you can make sure that it’s heard by submitting your story to our network reaching hundreds of news sites across 6 verticals.